The Best Performing Meta Ad Creatives for Ecommerce Products, by the Data
Offer banners, demos, reviews, benefit graphics, lifestyle scenes and product shots, ranked with data from 578,750 Meta ads and 386 long-running ecommerce ads.

Which Meta ad creative should an ecommerce store run: a discount banner, a product demo, a customer review, an infographic or a lifestyle photo? Most answers come down to opinion and a few percentages nobody can trace.
I wanted numbers. This post uses two data sets. The first is Motion's creative benchmark of 578,750 Meta ads across 6,015 advertiser accounts, which shows which formats turn into winners most often. The second is my own sample of 386 ads from six ecommerce product areas in Meta's Ad Library, each of which ran for at least 60 days, with how long each one ran and how many people it reached. Below I go through every creative type with both.
- Offer-first banners are the most used and pull the most spend. In Motion's data they are 21.9% of creatives, take 29.3% of spend and turn into winners 8.6% of the time.
- Unboxing and demo ads win often. In Motion's published table, unboxing has the highest hit rate (9.8%) while barely being used, and demos win 8.1% of the time.
- Lifestyle scenes reach the most people. In my sample, static scene ads had a median EU reach of 16,627, about twice the next static type.
- Offers run longest, benefit graphics most often go past six months. Offer-led ads ran a median of 116 days, and 31% of benefit graphics ran past 180 days.
- The right type depends on how the product is judged. Worn products sit on a person, room products in a scene, products that need convincing get benefit graphics and video.
- Put words on the image. In Motion's ranking of asset types, text-only and product-with-text images come first and second for hit rate. A plain product photo is 13th of 15.
- UGC wins often. UGC ranks 4th of 15 asset types for hit rate, though the popular fixed percentages behind it do not trace back to a study.
- Winners are rare. Only about one creative in twenty becomes a winner, so test two or three types side by side.
What "best performing" means in this post
There is no public data on which ads made money. So I use the two measures that are available, and I am clear about which is which.
- Motion's hit rate. Motion calls a creative a winner when it spends at least ten times its account's median creative spend, with a $500 floor. A format's hit rate is the share of its creatives that become winners. It measures what Meta chose to spend on, not profit. The data runs from September 2025 to early January 2026, so it includes Black Friday.
- How long an ad ran and how many people it reached. For my 386 ads I have the days each one had run when I collected it and Meta's EU reach figure: how many people in the EU saw it. Advertisers rarely keep paying for an ad that loses money for months, so a long run is a useful signal, but not proof. Reach is not impressions, and Meta only reports it for ads shown in the EU, so this sample is largely European.
Best performing Meta ads for ecommerce products
Here is the whole picture first. The first table is Motion's ranking of formats. The second is my own sample of static ads, sorted by eye, plus video for comparison.
| Format (Motion, 578,750 ads) | Hit rate | Share of creatives | Share of spend |
|---|---|---|---|
| Unboxing | 9.8% | 2.1% | 2.8% |
| Offer-first banner | 8.6% | 21.9% | 29.3% |
| Demo | 8.1% | 12.6% | 12.9% |
| Testimonial | 6.5% | 13.3% | 13.3% |
| Celebrity | 5.9% | 0.8% | 1.8% |
Motion also ranks what an ad is built from, its asset type. It publishes the order, not the numbers, and says hit rates across these types run from about 4% to 12%.
| Rank by hit rate | Asset type |
|---|---|
| 1 | Text only |
| 2 | Product image with text |
| 3 | Lifestyle image with the product in it |
| 4 | UGC |
| 5 | High production |
| 8 | UGC mashup |
| 9 | Lifestyle image with the product and text |
| 11 | Lifestyle image without the product |
| 13 | Product image |
| 15 | Carousel |
The pattern is clear: images that carry words, and UGC, find winners more often than high-production or plain imagery, and carousels come last.
| Creative type (my 386 ads) | Ads | Median days running | Ran 180+ days | Median EU reach |
|---|---|---|---|---|
| Lifestyle scene (static) | 44 | 90 | 25% | 16,627 |
| Benefit graphic or infographic (static) | 36 | 91 | 31% | 3,542 |
| Product on a plain background (static) | 35 | 67 | 9% | 7,862 |
| Offer-led (static) | 21 | 116 | 14% | 4,755 |
| Person or customer photo (static) | 19 | 71 | 11% | 283 |
| Review or testimonial (static) | 5 | 221 | 60% | 4,551 |
| All static | 171 | 90 | 19% | 5,726 |
| All video | 211 | 70 | 11% | 3,889 |
A few notes on reading the second table. Median reach is calculated only over ads that report a figure. I sorted the static ads by eye, so the type counts are approximate. And the review row has only five ads, so its numbers are too small to rely on.
1. Offer-first banner ads
An offer-first banner leads with the deal: a percentage off, a price, free shipping, buy one get one. It is the most used format in Motion's data by a distance, at 21.9% of all creatives, and it takes even more of the spend, 29.3%. Its hit rate is 8.6%, against a base of about 5%. Motion's hook ranking points the same way: the hooks that win most often are promotional ones, such as newness, a sale announcement, a price anchor and urgency.
In my sample, offer-led statics are 13% of the static ads, and they last: a median of 116 days, the longest of any type with a meaningful number of ads.
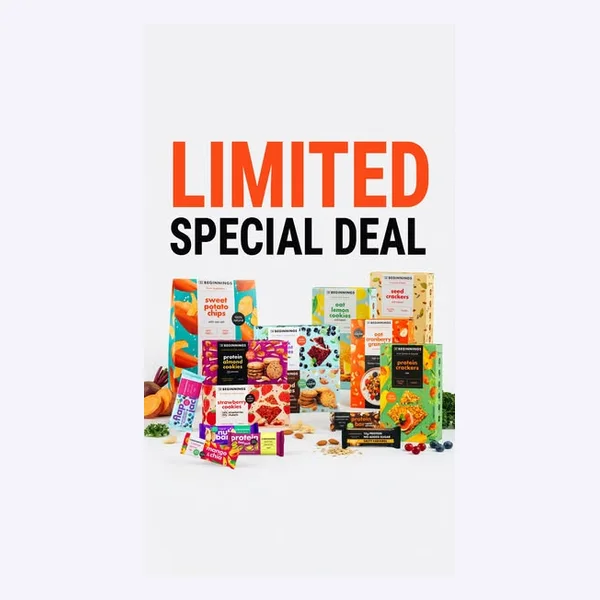
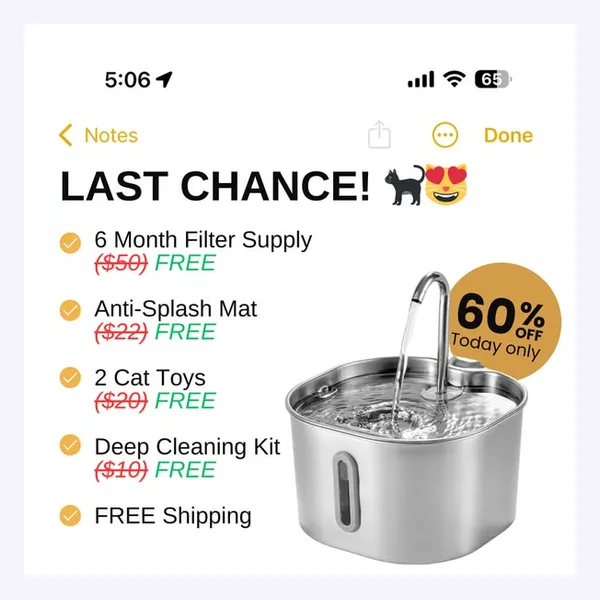
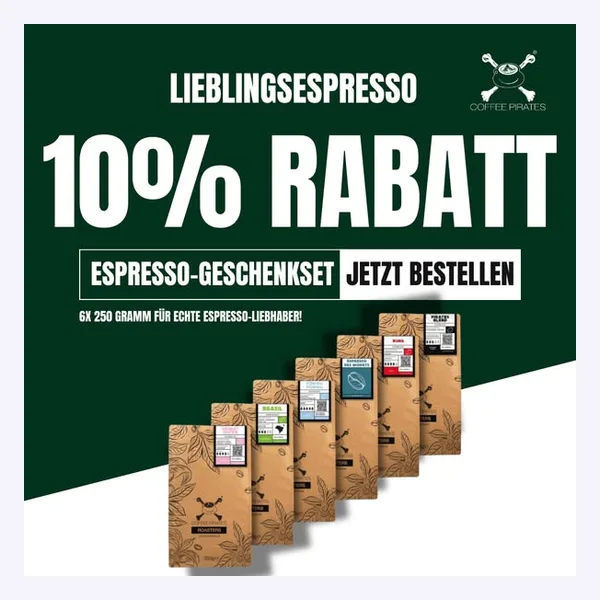
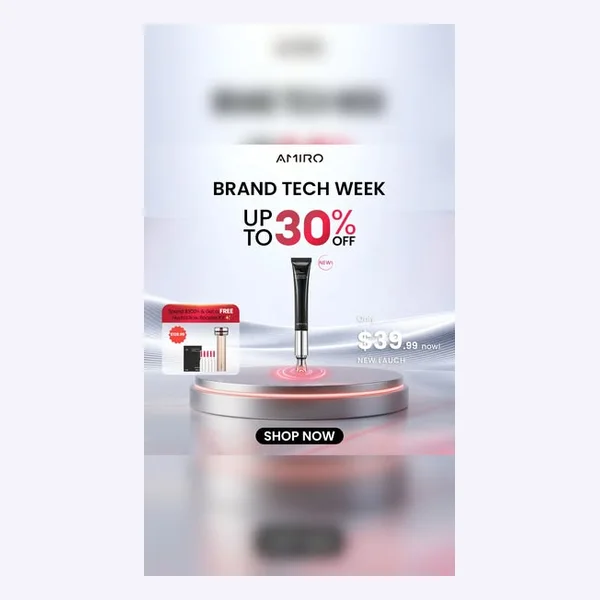
Use it when you have a real offer and a product people already understand. It is the safest first test for almost any store, and the easiest to make: an ecommerce ad creative generator can put a sale badge built from your real price on the product image. Remember that Motion's period includes Black Friday, which flatters promotions.
2. Product demo and unboxing ads
A demo shows the product doing its job. An unboxing shows someone opening it. Both are usually video. In Motion's published table, unboxing has the highest hit rate, 9.8%, while being only 2.1% of creatives. Demos win 8.1% of the time. If you only take one thing from Motion's table, it is that unboxing looks under-used for how often it wins.
My sample backs up how much video matters: 211 of the 386 ads, 55%, are video. How much depends on what is being sold.
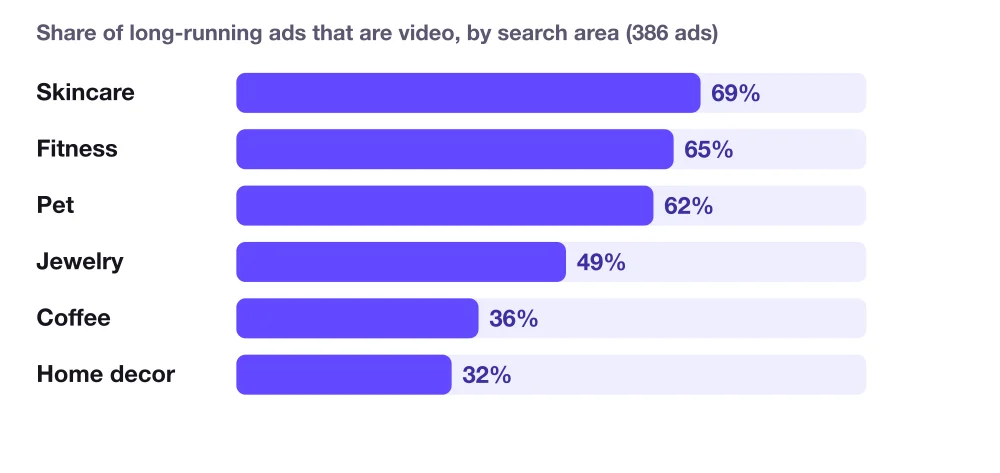
Skincare had the highest share of video, at 69% of its long-running ads, and home decor the lowest, at 32%.
The area is the keyword group an ad was found under, not a checked product category. Video ads in my sample ran a median of 70 days, shorter than static at 90, and fewer passed 180 days (11% against 19%). That is consistent with video being refreshed more often, not with video performing worse.
Use it when the product does something you can show: a gadget, a skincare result, a cleaning product, anything with a before and after. Show the same result again on the page the ad sends people to, because a demo that is missing from the product page loses the click it earned.
3. Testimonial and review ads
A testimonial puts a customer's words, face or star rating in the ad. In Motion's data it is a big format, 13.3% of creatives, with a 6.5% hit rate, above the base but below offers and demos. As a static graphic it is rare in my sample: only 5 of 160, too few to measure.
Use it when the buyer's main worry is "does it really work": skincare, supplements, anything priced high enough that people want proof.
4. Benefit graphic and infographic ads
A benefit graphic is the product with its reasons around it: a checklist, a comparison table, callouts, numbers. It is the second most common static type in my sample, 23%, and the most durable: a median of 91 days, and 31% ran past 180 days, the highest share of any type with enough ads. Its reach is lower, a median of 3,542, which suggests these ads keep running steadily rather than going wide.
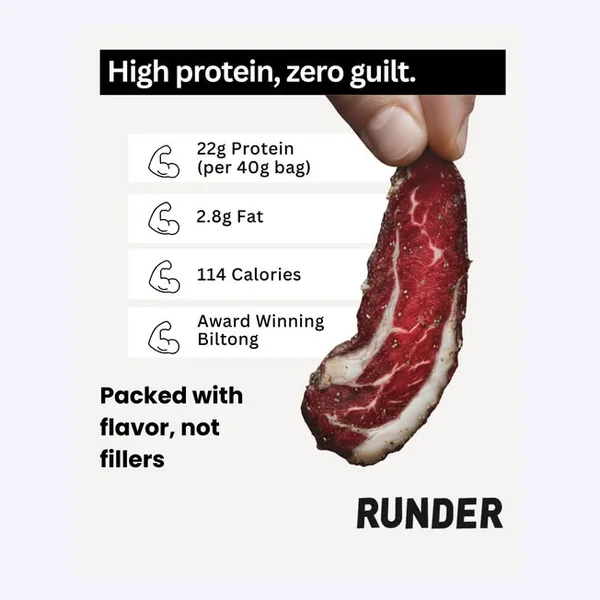
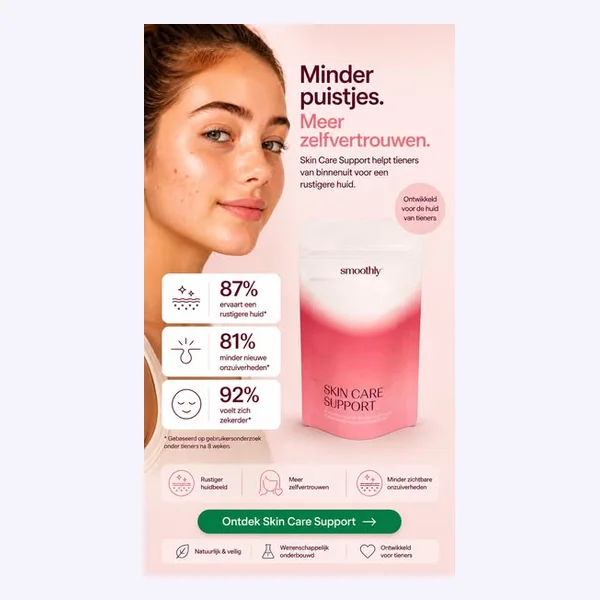
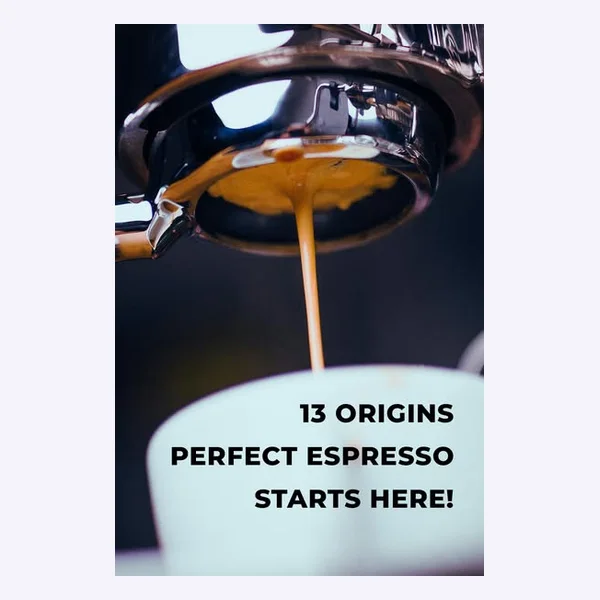
In Motion's asset ranking, text-only and product-with-text images are the top two for hit rate, which is the same family.
Use it when the product needs explaining: protein content, ingredients, a comparison with what the buyer uses now. In my sample it leads the static ads in fitness (38%) and skincare (30%). The benefits on the ad and the benefits in the product description should be the same list, in the same words.
5. Lifestyle scene ads
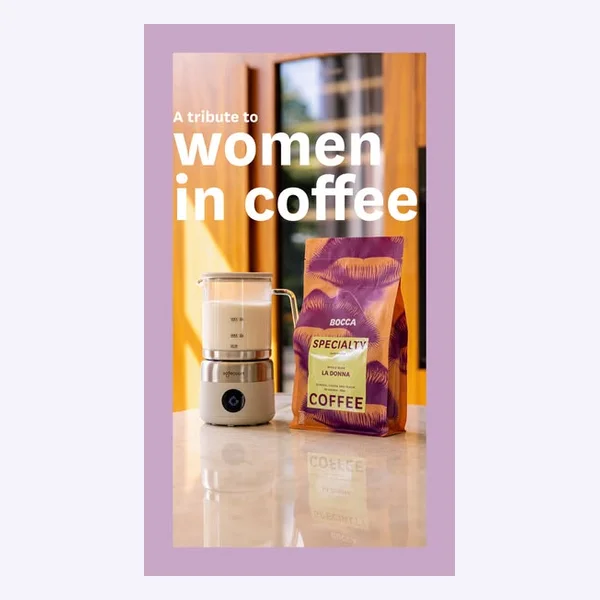
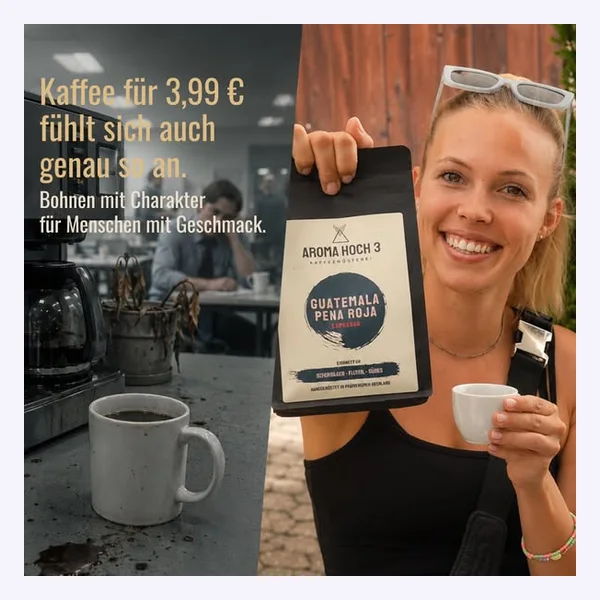
A lifestyle scene shows the product where it is used: a candle in a room, coffee outdoors, a sculpture on a shelf. It is the most common static type in my sample, 28%, and it reaches the most people by far: a median EU reach of 16,627, and more than half of these ads reached over 10,000 people. A quarter ran past 180 days.
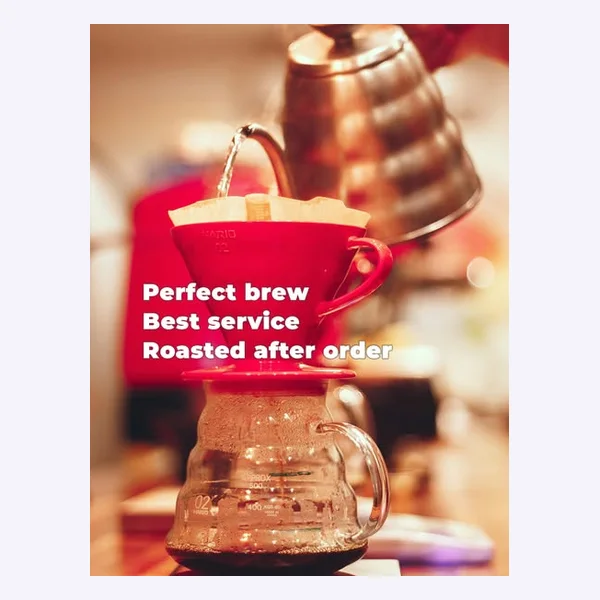
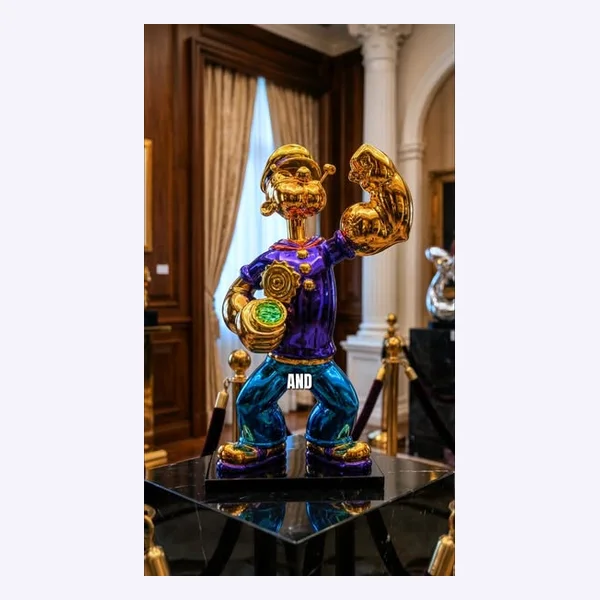
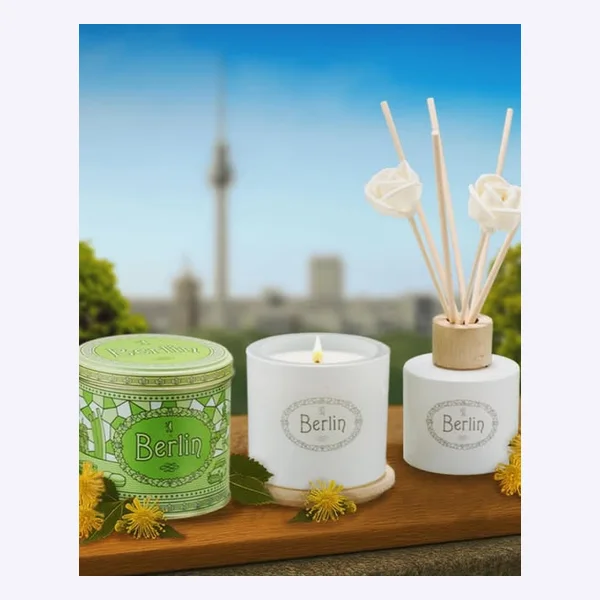
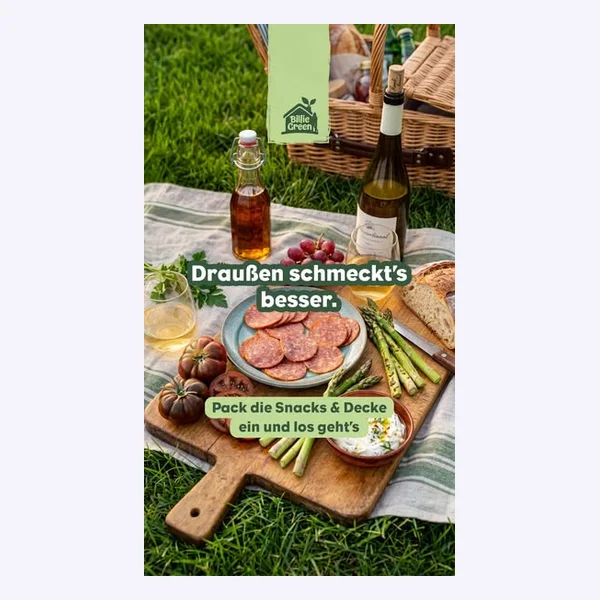
Motion's asset ranking adds a useful detail: a lifestyle image with the product in it ranks 3rd for hit rate, while a lifestyle image without the product ranks 11th. Keep the product in the scene. You do not need a shoot for it: AI lifestyle product photos can place the product in a room or a setting from a single product shot.
Use it when the buyer judges the product by how it looks in their life: home decor, furniture, candles, food and drink. It leads the static ads in home decor (53%) and coffee (39%). I wrote more about choosing between a scene and a plain shot in what a Meta ad image should show.
6. Product on a plain background
The product alone, on white or a flat colour. It is 22% of the static ads, with a median reach of 7,862, the second highest. It ran shorter, a median of 67 days, and only 9% passed 180 days, which fits its use as a steady catalog-style ad rather than a long-running hero. Motion's ranking agrees: a plain product image is 13th of 15 asset types for hit rate, while the same image with text on it is 2nd.
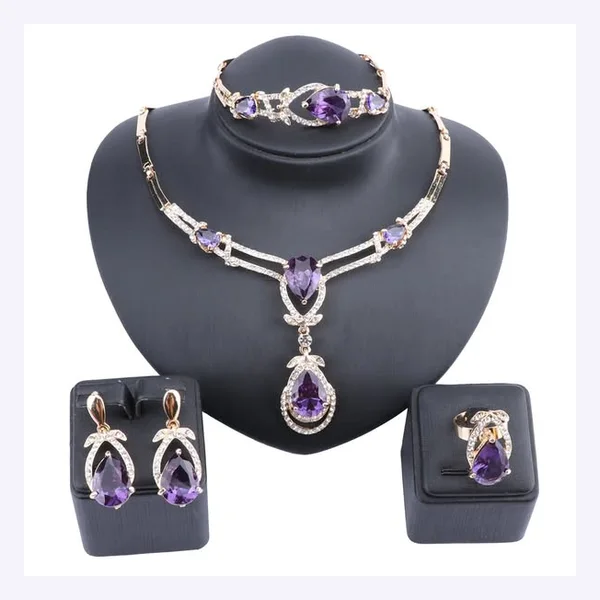
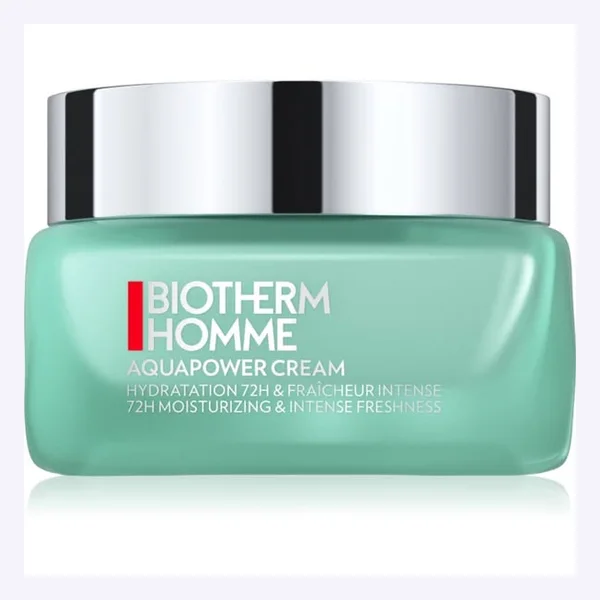
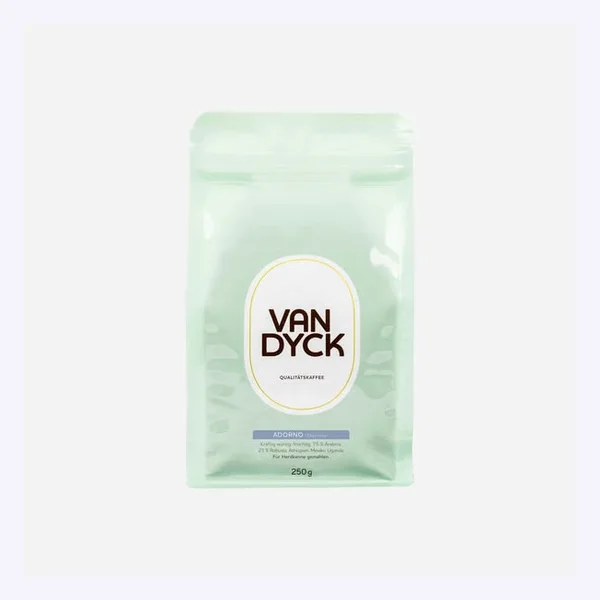
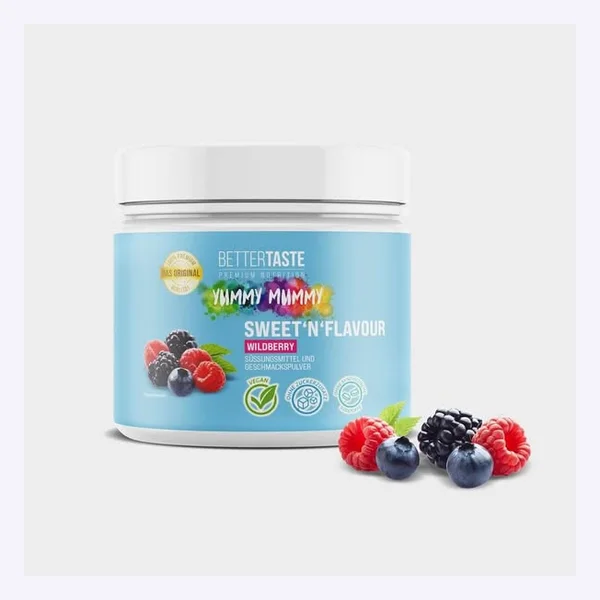
Use it when the product is simple and recognisable at a glance, and as a clean second variant next to a scene or a person.
7. Person and customer-photo ads
A person wearing or holding the product, or a photo that looks like a customer took it. This is where UGC-style ads sit. It is 12% of the static ads in my sample, and it had the lowest median reach, 283, though only 15 of these ads report a figure. Motion's asset ranking is the strongest evidence I found on UGC: it is 4th of 15 for hit rate and 4th for spend use ratio (spend earned against how often it is used), and UGC mashups are 8th. The fixed percentages that circulate, such as UGC beating studio ads by 35 to 38 percent, do not trace back to a study, but the ranking itself is solid.

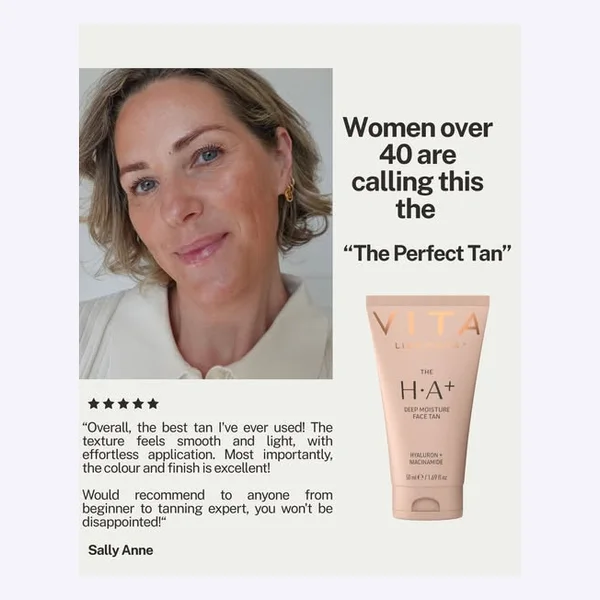
Use it when the product is worn or used on the body, like jewelry and clothing, where it leads the static ads with plain shots (35% each in jewelry). For UGC as a style, it is one of the strongest concepts to put up against an offer or a demo, and it doubles as organic content: the same material works as ecommerce social media posts.
What the copy says on long-running ads
The image is only half the ad. I also looked at the primary text and headline of all 386 ads. I coded these features automatically from the text, so treat them as approximate, and remember they show what long-running ads have in common, not what causes a result.
| Copy feature | Share of ads | Median days running, with / without | Median EU reach, with / without |
|---|---|---|---|
| Mentions a price, discount or something free | 42% | 70 / 89 | 4,551 / 4,066 |
| Opens with a question | 16% | 118 / 71 | 5,363 / 4,459 |
| Uses emoji | 67% | 69 / 112 | 4,456 / 5,151 |
| Primary text length | Ads | Median days running | Median EU reach |
|---|---|---|---|
| Under 20 words | 28 | 116 | 2,264 |
| 20 to 59 words | 120 | 90 | 7,387 |
| 60 to 119 words | 136 | 69 | 4,441 |
| 120 words or more | 102 | 70 | 4,402 |
Three things stand out. Ads that open with a question ran much longer, a median of 118 days against 71. Ads with 20 to 59 words of primary text reached the most people, a median of 7,387. And the two-thirds of ads that use emoji ran shorter than the ones without. The typical long-running ad has about 75 words of primary text and a five-word headline.
Which creative type for which product
Putting both data sets together gives a starting point for each kind of product.
| If your product is | Start with | What the data shows |
|---|---|---|
| Worn: jewelry, clothing, accessories | A person wearing it, plus a plain shot | In jewelry, 35% of statics show a person and 35% a plain product |
| Lives in a room: decor, candles, furniture | A lifestyle scene | Scenes are 53% of home decor statics and have the highest median reach of any type |
| Needs convincing: skincare, supplements, fitness food | Video demo, benefit graphic, testimonial | Skincare ads are 69% video and fitness 65%; benefit graphics lead their statics |
| Bought again: coffee, food, consumables | A lifestyle scene and an offer | Coffee statics are 39% scenes, and only 36% of coffee ads are video |
| On sale, or newly launched | An offer-first banner | Highest share of spend in Motion's data, and promotional hooks win most often |
Two caveats. The sample sizes per area are small outside coffee (54 statics) and fitness (42), so treat the percentages as directions. And Motion's own data shows that top formats change a lot by category: the top formats for health and wellness barely overlap with those for fashion. That is why I treat the table above as the first test to run, not the final answer.
What a normal result looks like for ecommerce on Meta
Per-ad clicks and CTR are not public, so I cannot show them for the examples above. What is public is how the average ecommerce brand performs. Triple Whale's Meta ads benchmarks cover more than 40,000 brands from August 2025 to July 2026. Across all of them, the median CTR was 2.39%, CPM $15.06, conversion rate 1.53%, cost per purchase $38.99 and ROAS 1.88.
By category, the medians look like this:
| Category | CTR | Conversion rate | Cost per purchase | ROAS |
|---|---|---|---|---|
| Apparel and accessories | 2.44% | 1.47% | $36.98 | 2.24 |
| Beauty | 2.46% | 1.79% | $39.31 | 1.54 |
| Home and garden | 2.38% | 1.24% | $47.93 | 2.25 |
| Food and beverage | 1.98% | 1.89% | $38.57 | 1.61 |
| Health and wellness | 3.02% | 1.50% | $40.53 | 1.44 |
| Sports and outdoors | 2.01% | 1.28% | $44.53 | 2.35 |
| Pets and animals | 2.37% | 1.63% | $38.51 | 1.60 |
| Lifestyle and boutique | 2.44% | 1.62% | $31.16 | 2.04 |
| Electronics | 2.41% | 1.13% | $51.86 | 1.94 |
Two things stand out. Health and wellness has the highest CTR, 3.02%, and the lowest ROAS, 1.44: people click, and fewer of them buy. Home and garden has an average CTR but one of the highest costs per purchase, $47.93. Use your own category's row as the line your creative tests have to beat, and judge on cost per purchase, not CTR.
Winners are rare, so test two or three types at once
In Motion's data about one creative in twenty becomes a winner, and those winners take 55% of all spend. Accounts that launch more creatives find more winners: in the $50,000 to $200,000 monthly spend tier, the average account launched 6.6 creatives a week and found 0.7 winners a month, while the top quarter launched 15.9 and found 2.0. Smaller accounts follow the same shape: between $10,000 and $50,000 a month, the average account launched 4.1 creatives a week and found 0.2 winners a month, the top quarter 8.0 and 0.5. Below $10,000 a month, accounts launched 2.8 a week and found almost no winners at Motion's threshold.
You do not need sixteen a week. You need two or three genuinely different types in each test, for example an offer banner, a demo and a lifestyle scene for the same product, and a way to judge them by cost per purchase rather than clicks. Meta's developer documentation asks for about 50 optimization events per ad set over seven days. At the median ecommerce cost per purchase of $38.99, that is around $1,950 a week, or $279 a day, for one purchase-optimized ad set, so the number of types you can test at once depends on your budget. The full method, from the hypothesis to reading the winner, is in how to test Meta ad creatives.
If the ads get clicks and no sales, the creative may not be the problem. We go through where to look in why a store gets traffic but no sales.
Making these creatives without a designer
The slow part of testing types is making enough of them. BrandyBee builds them from your product data: the offer banner with your real price, the benefit graphic, the lifestyle scene and the plain shot, so two or three types can go head to head the same day. You choose which ones.
Meta ad creative statistics
The main numbers from both data sets in one place:
- In Motion's creative benchmark of 578,750 Meta ads from 6,015 advertiser accounts, offer-first banners were 21.9% of creatives and took 29.3% of spend.
- Unboxing had the highest hit rate in Motion's format table, 9.8%, while making up only 2.1% of creatives. Offer-first banners became winners 8.6% of the time and demos 8.1%.
- In Motion's data, about one creative in twenty becomes a winner, and those winners take 55% of all spend.
- In my sample of 386 ecommerce ads that ran at least 60 days in Meta's Ad Library, 55% were video.
- The share of video ranged from 69% of long-running skincare ads to 32% in home decor.
- Static ads ran a median of 90 days against 70 for video, and 19% of static ads passed 180 days against 11% of video.
- Static lifestyle scene ads had a median EU reach of 16,627, about twice that of the next static type.
- Offer-led static ads ran a median of 116 days, and 31% of benefit graphics ran past 180 days.
Best Meta ad creatives for ecommerce FAQ
What is the best performing Meta ad creative for ecommerce?
There is no single best, but the data points in a clear direction. In Motion's 578,750 ads, offer-first banners take the most spend (29.3%) and unboxing and demo ads have the highest published hit rates (9.8% and 8.1%). In my 386 long-running ecommerce ads, lifestyle scenes reached the most people and benefit graphics ran the longest.
Are video or image ads better on Meta for ecommerce?
Both are used heavily. In my sample, 55% of long-running ecommerce ads were video, ranging from 69% in skincare to 32% in home decor. Static ads ran longer on median, 90 days against 70, which fits video being refreshed more often.
Do UGC ads work better than polished ads?
UGC ranks 4th of 15 asset types for hit rate in Motion's data, above high-production ads in 5th, so it wins often. The fixed percentages that circulate do not trace back to a study. Put UGC in a test next to an offer or a demo and keep the one with the lower cost per purchase.
What should a Meta ad for a new product show?
Start with an offer-first banner if you have an offer, plus a demo or a lifestyle scene depending on whether the product is used or displayed. Promotional and newness hooks have the highest hit rates in Motion's data.
How many creative types should I test at once?
Two or three, clearly different from each other. Only about one creative in twenty becomes a winner, and your budget has to give each ad set enough events to learn.
What is a good CTR for Meta ads in ecommerce?
Across more than 40,000 brands in Triple Whale's data for August 2025 to July 2026, the median CTR was 2.39%, ranging from 1.98% in food and beverage to 3.02% in health and wellness. CTR alone is a weak target: the category with the highest CTR also had the lowest ROAS.
How long should Meta ad copy be?
In my 386 long-running ecommerce ads, the median primary text was about 75 words, and ads with 20 to 59 words had the highest median reach. Ads that opened with a question ran longest.
What does "ran 60+ days" mean in the captions?
It is how long the ad had been running when I collected it. Many of these ads have stopped since, and some kept running longer, so read it as a minimum.